
SingleOps Dashboards are Here!
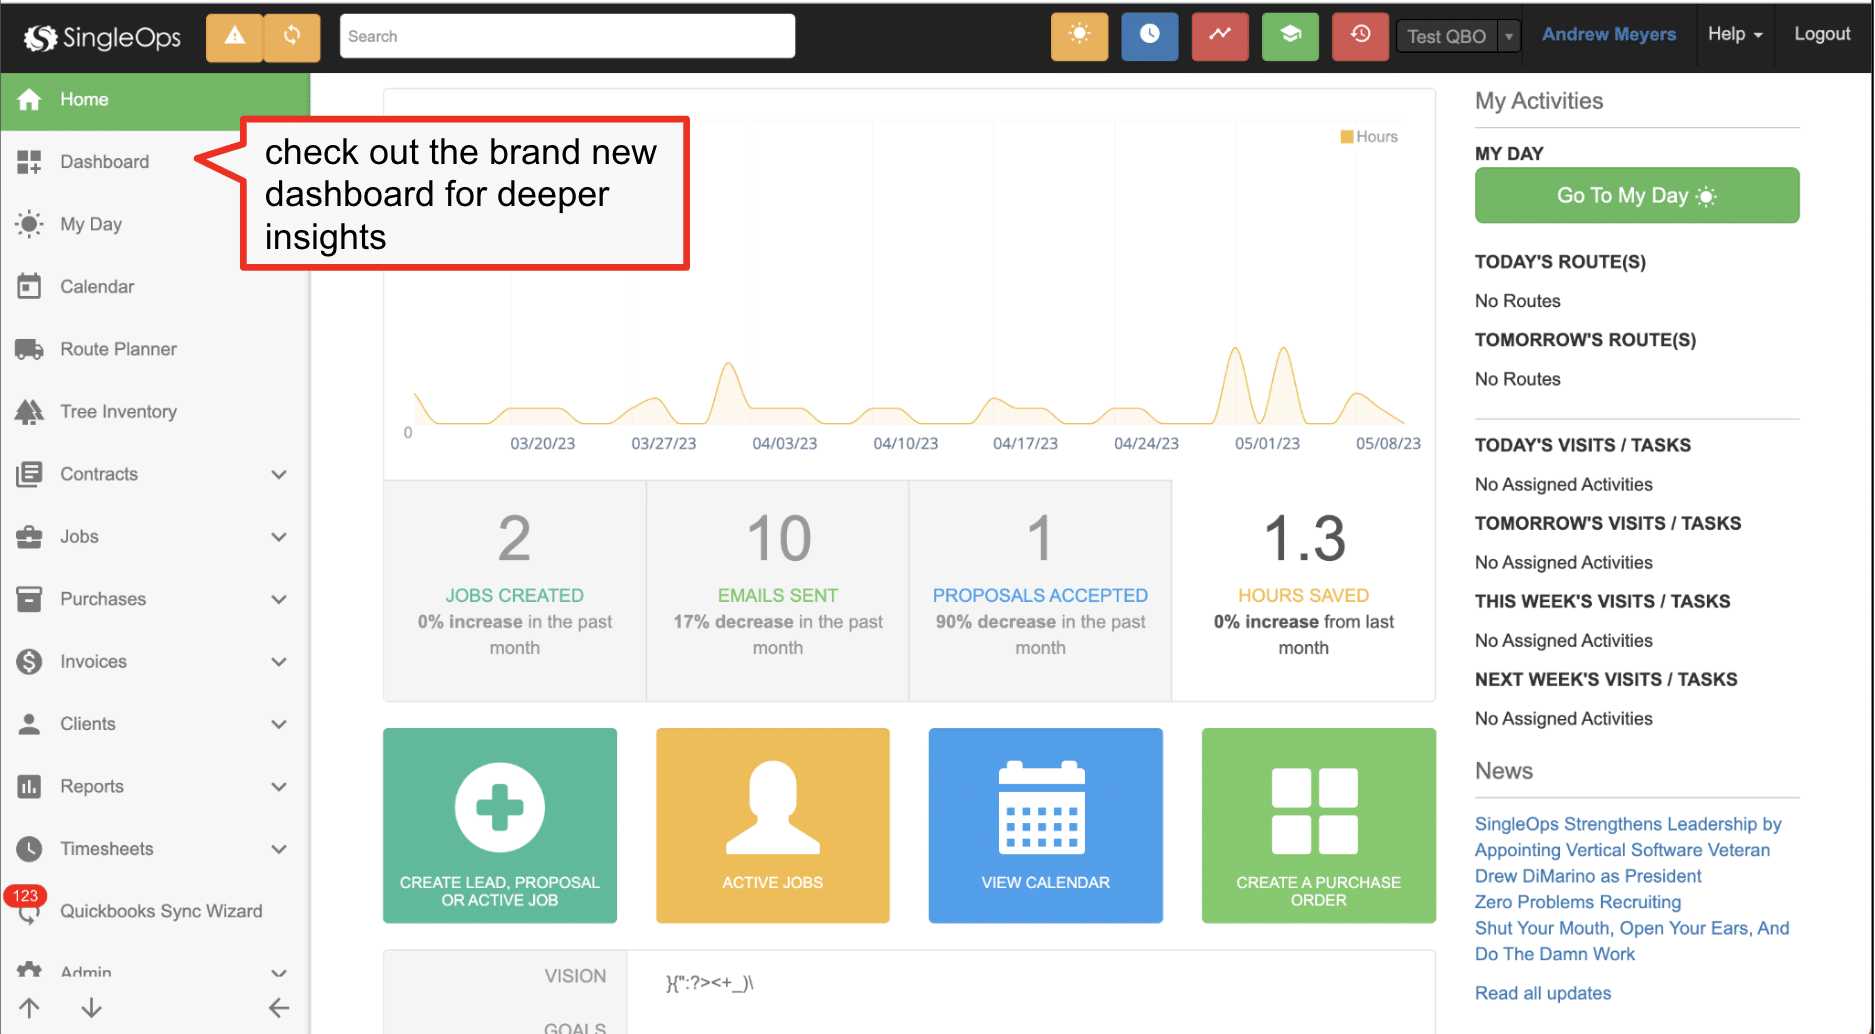
We are constantly working to improve your SingleOps experience. Today we’ve added a game-changing update to all tiers of service that will streamline your workflow and make reporting a breeze! Check it out!
SingleOps Dashboards
Introducing SingleOps Dashboards, where all your company’s data is consolidated into one unified interface to streamline reporting. Gain comprehensive visibility into sales, labor, and revenue metrics, unlocking valuable insights to make informed decisions.
- All-in-One Data Management: Monitor several key metrics such as Revenue Over Time, Proposal Conversion, Sale Leaderboards, and more at a glance.
- Simplify Reporting: Streamline the process of generating reports and analyzing data, saving businesses time and effort while enabling them to make data-driven decisions.
- Easy-to-Understand Visuals: Present charts, graphs, and other visual elements in an easily understandable and engaging manner.
- Improve Collaboration: Provide a shared platform for your team to exchange information, track customer interactions, and work together on projects.
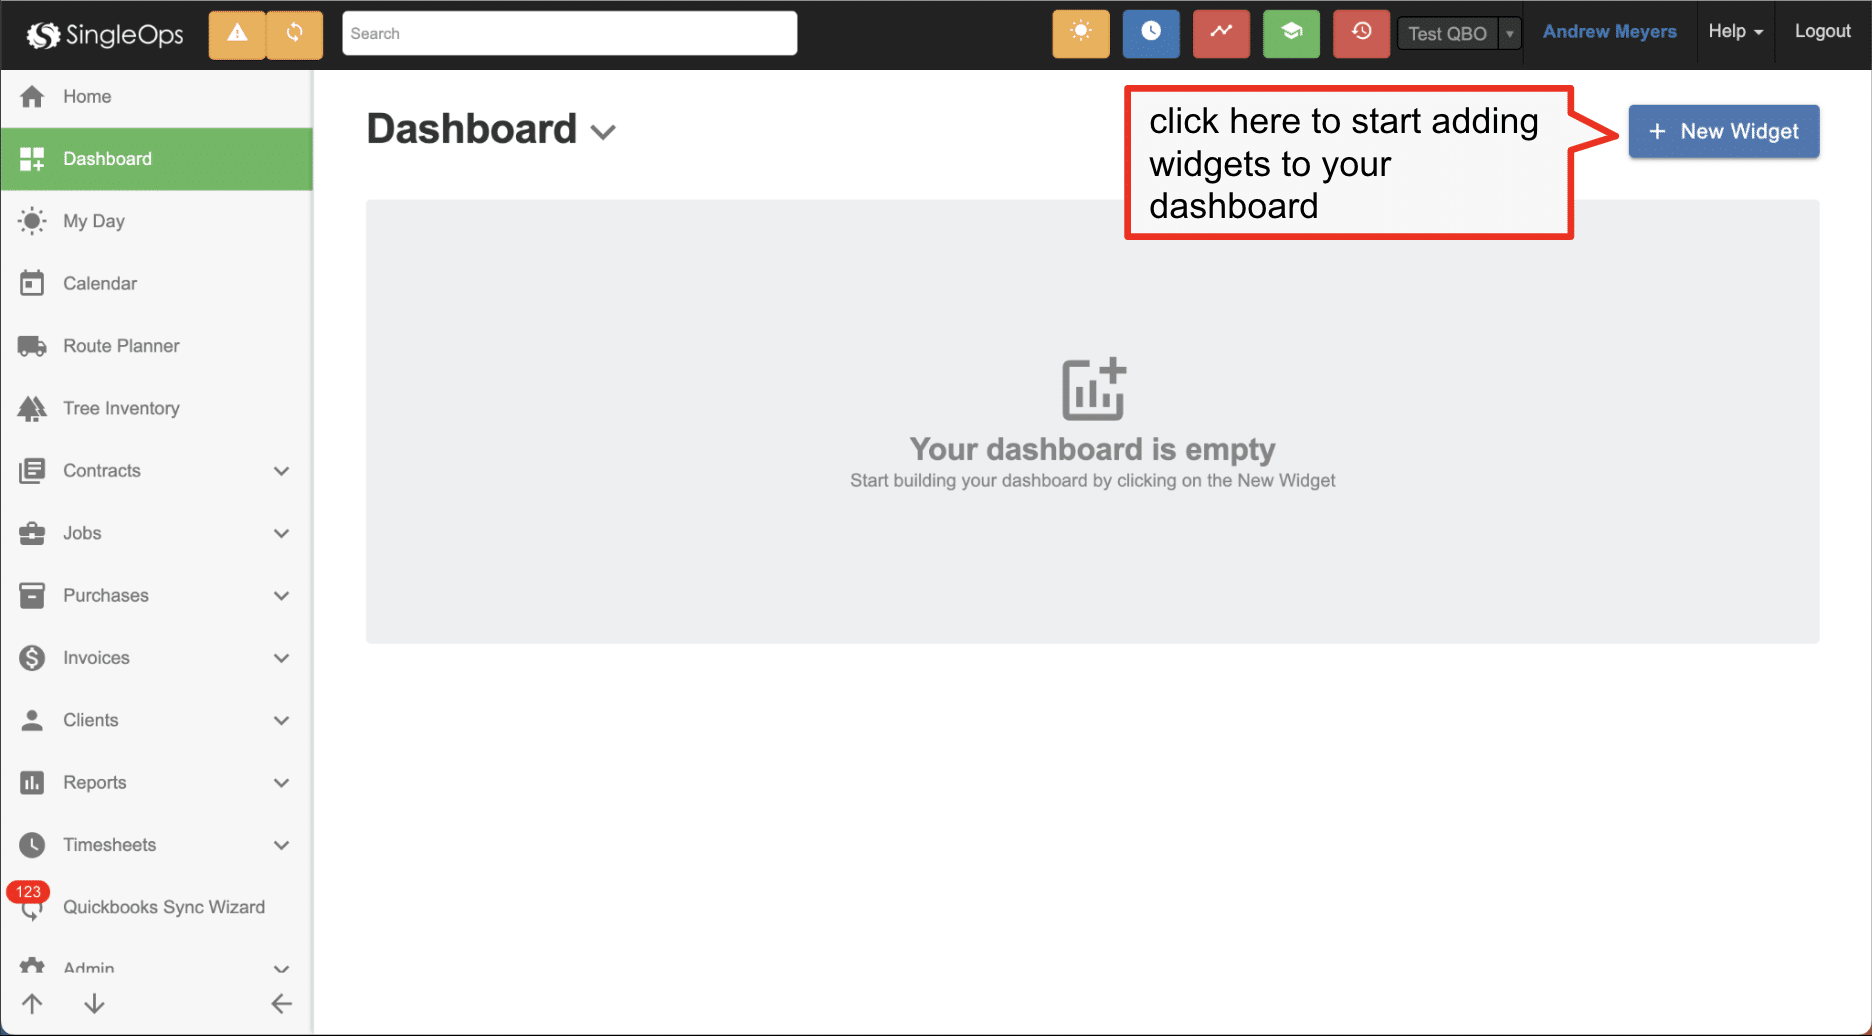
Dashboard Widgets
Widgets are the core components that makeup SingleOps Dashboards. They help you visualize and summarize the data stored within SingleOps. You have the ability to add, remove, edit, resize, and arrange widgets, as well as refresh widgets for the most up-to-date info in real time.
Your Widgets:
- Revenue Over Time
- Margin Per Man Hour
- Labor Progress Report
- Sales Over Time
- Sales Leaderboard
- Proposal Conversion
- Revenue Per Man Hour
Dashboard visibility is limited to specific account roles. (i.e. Dashboards will be available for admin and operator account roles)
Learn More about Dashboards and Widgets: Here.